
BTCUSD - Technical Analysis October 23, 2017 - Current Price $5872
BTCUSD
We did just look at BTCUSD at the end of last weak but with the fork moments away and the price volatility today, it is important to keep an eye on Bitcoin.
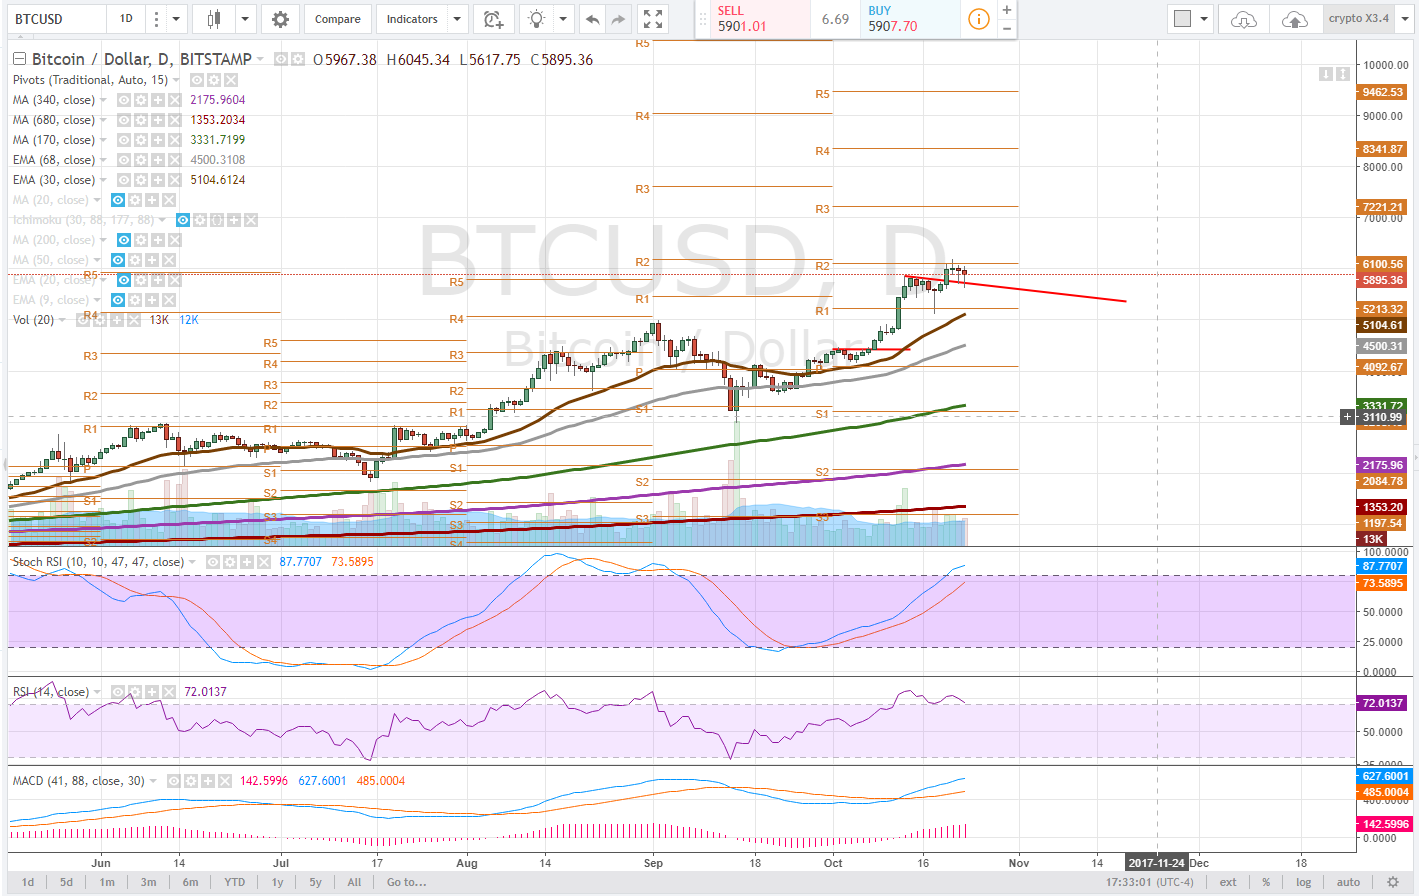
Daily
Since breaking out of the bull flag we spotted that led to the 6100's BTC had pulled back as far as the $5620's. Creating lots of opportunities for individuals to take positions or profits ahead of the fork.
After breaking out of the bull flag resistance our red trendline from the previous analysis it appears that BTCUSD has backtested it twice. Each time the buyers stepped in to scoop it up. This trendline is critical to hold on the daily time frame as there is not much support underneath that level. Resistance was found at pivot r2, with the price breaking just above not before selling off an forming a reversal doji just 3 days ago.
The RSI is still in overbought territory, however, we know this can go on for some time.
The daily time frame is in a consolidation cycle. No doubt some holders have taken their BTCUSD to cold storage for safe keeping, creating a similar situation as the August 1 fork with block chain bottlenecks and lowered liquidity on the exchanges.
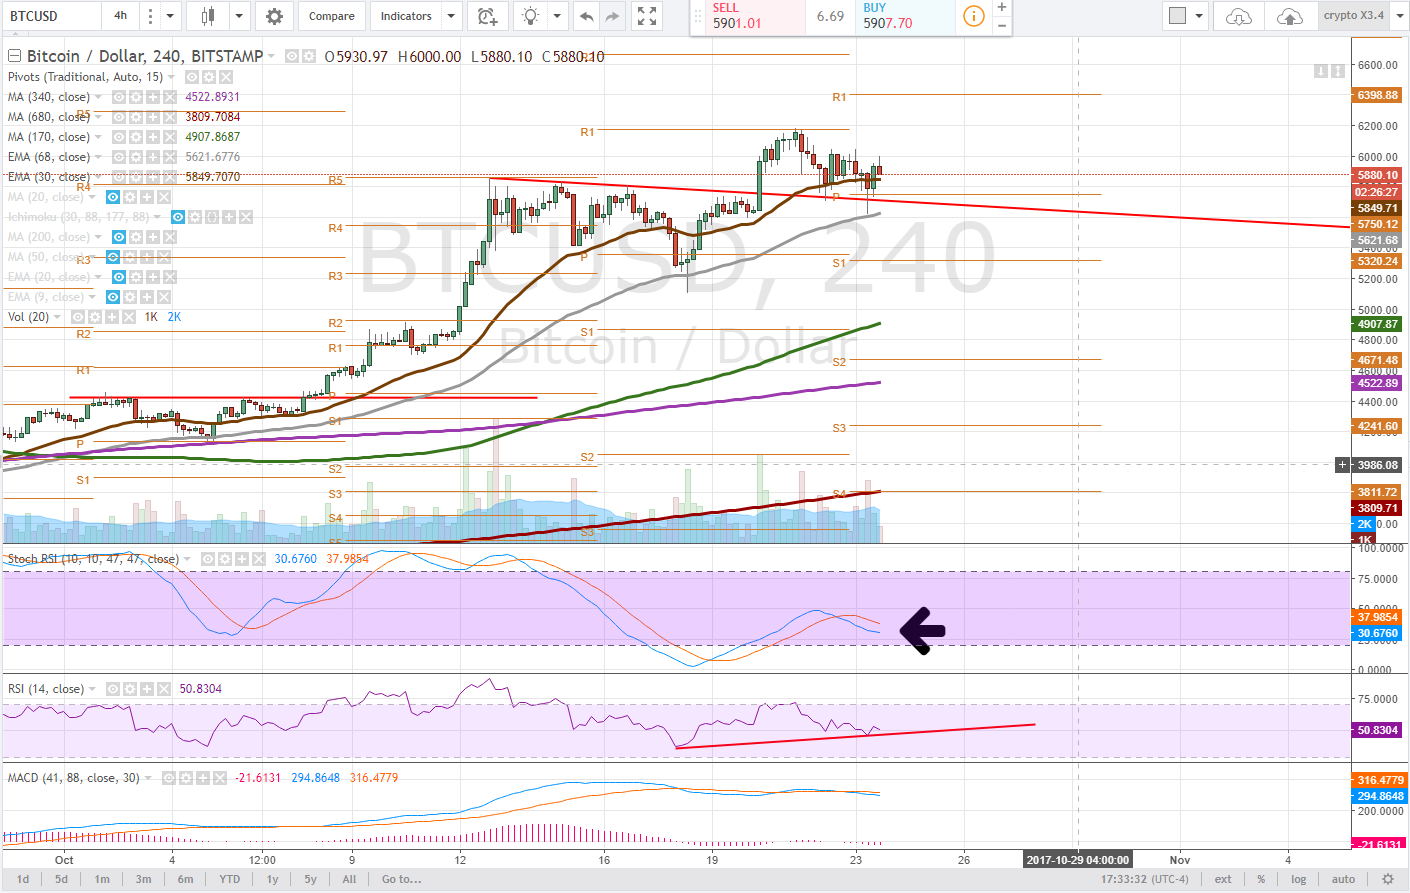
4 hour
On the 4 hour time frame, we are taking note of the slight uptrend in the RSI where it is hovering in a neutral territory as we watch the stochastic RSI for a curl upwards and possible bullish divergence.
The MACD is well above deviation zero on this time frame but the bearish momentum was seemingly nominal and may start to wane.
Bulls are watching for the 30ema and 4 hour pivot to hold as support as the price bounced back above the bull flag trendline when support was found at the 68ema. To demonstrate the strength of moving average support, look at how the price behaved in the past at the 68ema.
1 hour
The RSI on the 1 hour time frame is finding clear resistance in the midground and will have to break 1 way or the other.
The stochastic RSI is fully cycled and the MACD, while it was trending down never created a significant divergence. As it is right around the zero lines traders should be watching for a point of inflection here.
Moving average support is a convergence of the 30ema and 68 ema. If you notice the 170dma has also converged with the pivot. This is the next must hold level or it appears a move below that trendline support is likely.
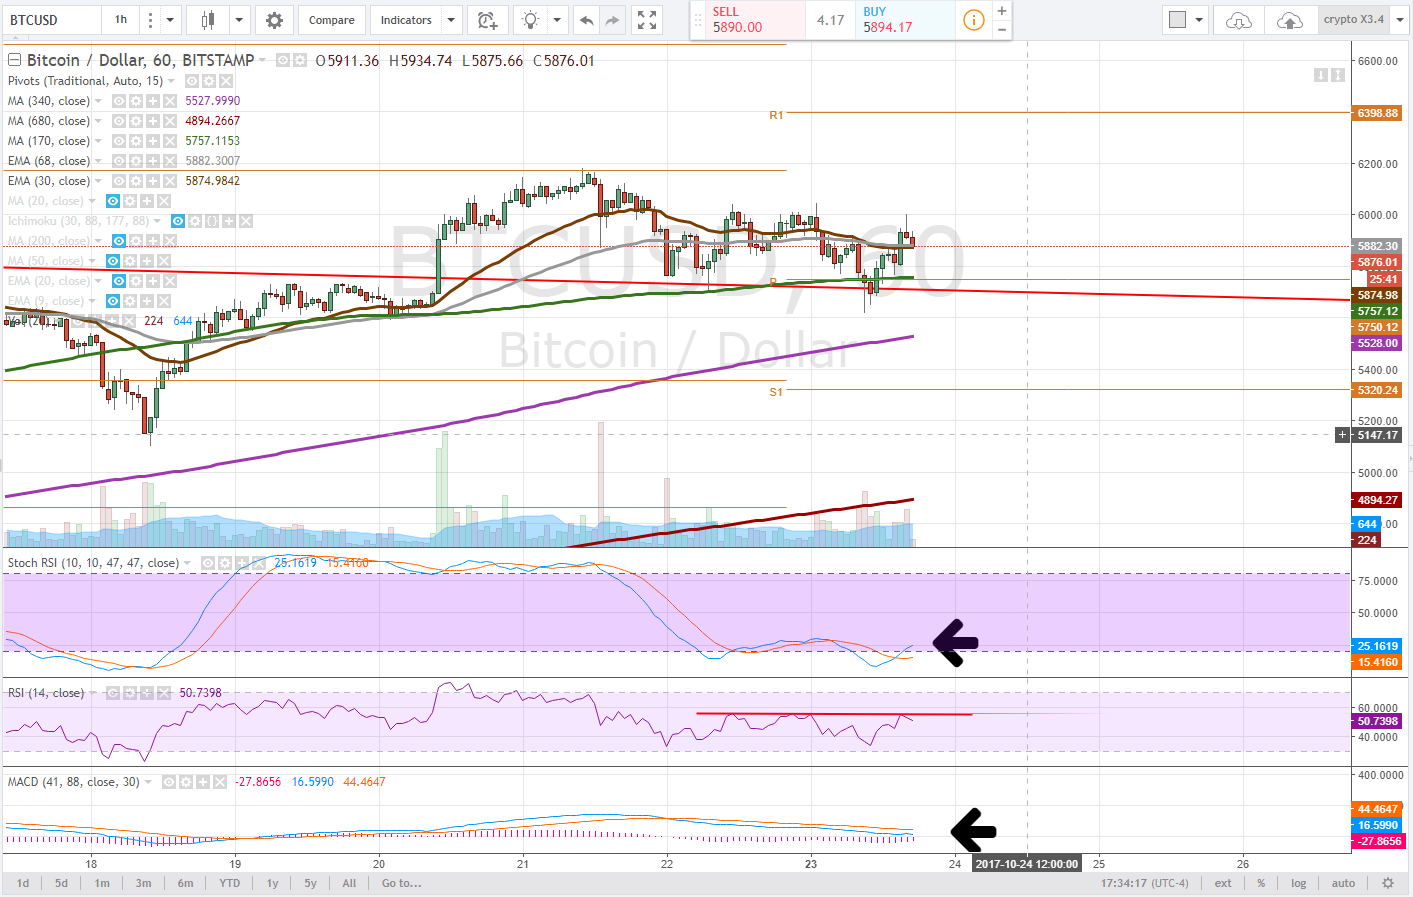
Bullish Above: previous high on this time frame, $6044, would be looking for a break above the all-time high for a test of pivot R1
Bearish Below: $5750 ... very bearish below trendline $5700
RISK TRADE: If you are not in it, wait until after the fork, then long or short accordingly. Watch alt crypto BTC pairings as well for trading opportunities as BTC holders will possibly sell off after the snapshot to buy the likes of ETH XMR LTC ZEC NEO
Don't forget to use stop losses!!!
No comments